
The accessibility of eCommerce has empowered businesses of all kinds to grow at an exponential rate.
Think about it: how many online-only businesses are there these days? A lot.
Actually, according to Pipe Candy, there are about 2-3 million eCommerce companies in the world—excluding China.
Because of the influx of online businesses, there’s more competition than ever before, as you can probably imagine. So how are you supposed to stand out from the masses?
Like many things online, there’s an overwhelming amount of information out there on how to grow your business.
Start an email newsletter.
Stay active on social media.
Perfect your customer service experience.
Don’t forget about branding.
Ship packages on time.
That’s not to say you shouldn’t do these things. All of these strategies are important to growing a healthy (read: profitable) eCommerce business.
But how can you be sure that the tactics you’re implementing are the right ones? How do you know if you’re moving the needle?
Key performance indicators (KPIs). That’s how.
Even still, how do you know which metrics to track? There are so many things to keep tabs on.
In this post, we’re taking a look at some of the crucial KPIs eCommerce businesses should keep a steady pulse on.
But before we do that, let’s go back to the basics for a second. Because, quite frankly, it’s useless to understand difference metrics if you aren’t sure why they matter or how they can help grow your business.
Let’s get to it.
What is a KPI?

First thing’s first, what’s a KPI, anyway?
A KPI is a type of measurement that evaluates the success of a tactic or strategy. In other words, KPIs help marketers and business people determine how things—like email and logistics—are performing. Think of it as a gauge of how your efforts are directly impacting your business. A gut-check of sorts.
KPIs not only help you determine whether you are being successful but gives you leading indicators to where you should pay attention. A great KPI dashboard not only allows you to see how a specific KPI is performing compared to your target, but also whether there are any fluctuations that you need to take action on.
Let’s say your Cart Abandonment Rate has been steady at 30% for the last 13 weeks. Then all of a sudden it spikes to 50%. Your KPI dashboard enables you to see that something has changed, and you can check why the number changed, so you can rectify it if needed. A decrease in conversion rate might be perfectly fine if you are exploring new marketing activities.
How do you determine what KPIs you should track?
We know that KPIs are essential for growing an eCommerce business, but which ones are going to help you see real growth?
To determine what KPIs you need to monitor, you need to figure out what you’re trying to accomplish first.
You see, KPIs on their own don’t give you the full story of how things are performing. That’s why it’s important to understand your goals before you worry about tracking numbers and percentages.
Think about what your goals are:
- Do you want to increase your number of online sales?
- Do you want to drive more site traffic?
- Do you want to grow your email newsletter list?
Take a moment to figure out precisely what your goals are before you start to track every KPI under the sun. Stick to three to seven KPIs, preferably closer to three than seven (as advocated by the great business book Traction).
Why monitor only a few? Your monitoring will have more purpose, and you’ll be able to make the right decisions about how to grow your business.
Also, it’s important to understand that no KPI can stand alone. You can’t just check your Return on Ad Spend (ROAS) by itself and determine whether your marketing is effective. A better ROAS, but fewer repeat purchases might be bad for business.
You can’t define a master KPI (although many of us try), but you can definitely find a list of key performance indicators that will indicate whether performance is not what they are supposed to be.
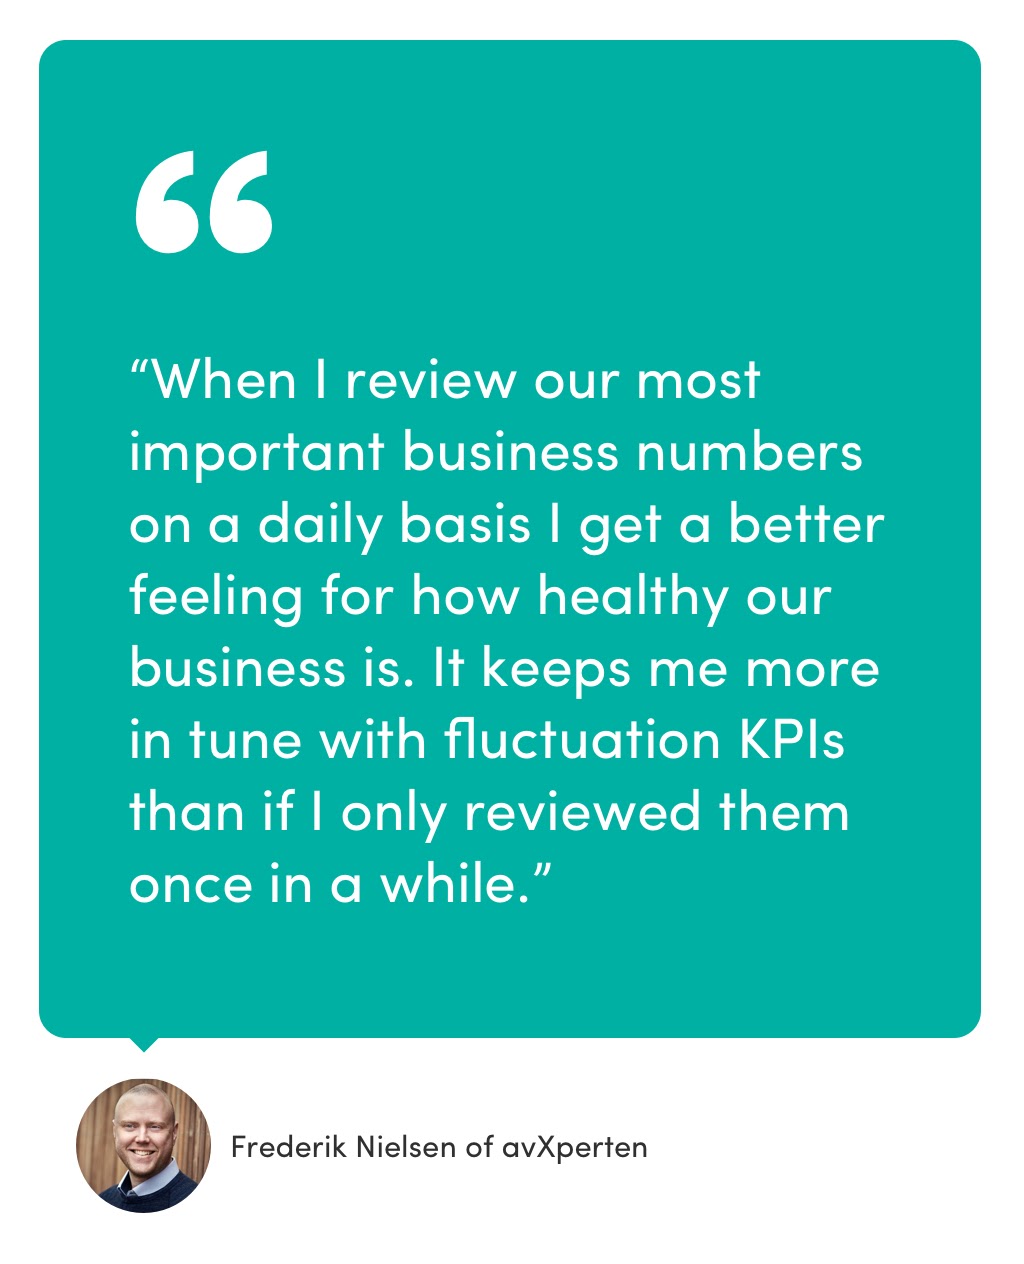
You should ideally show data for each KPI for the last 13 weeks, and if at all possible compare each week with the same week the month before. This is highly situational, though. Weekly might be too much for some KPIs, but monthly might be way too late.
A long-time client of ours, Frederik Nielsen of avXperten, actually look at KPIs on a daily basis:
Also, be careful about choosing a KPI that will fluctuate too much from week to week (for instance, if your conversion rate increases on payday).
The idea behind KPIs is that they enable you to take action when you need to. If your KPI review meeting is one extended “excuse finding mission,” then you might as well not look.
Now that we know how to figure out what KPIs to track and how to approach monitoring let’s take a look at some of the most important ones.
1. Sales Conversion Rate

Your sales conversion rate is simply the total number of sales you’ve made over a specific period. This metric helps you determine roughly how much site traffic you need to generate sales and can help you optimize your traffic-driving efforts.
To calculate your sales conversion rate, take the total number of sales for a certain period and divide that by the total number of sessions, visits, or unique visits (pick your poison) to your site during that same period.
For example, if you’ve made 10 sales and had 100 visitors to your site, your average sales conversion rate is 10%.
How do you know if your conversion rate is a “good” one or not? That will largely depend on the type of eCommerce business you’re running.
According to BigCommerce, the average conversion rate for this industry is between 1% – 2%. But again, many factors contribute to a conversion rate, like the type of product you sell or your average sales cycle, so it’s crucial to set your own benchmarks.
2. Cost per Acquisition (CPA)
You spend a lot of time trying to gain more customers, but how much are you actually spending on acquiring a new customer?
That’s why understanding your Cost per Acquisition (CPA)—sometimes called Customer Acquisition Cost (CAC as the D2C guys love to call it, but I lived in Central America for nine years, and CACA means poop, so I’m not fond of saying CAC ;))
This metric will tell you how much it costs to acquire each customer through each of your channels.
Want to know how expensive it is to acquire customers through PPC? No problem.
What about your email newsletter? Yup, you can see that as well.
Tracking your CPA is really only useful if you have a specific customer acquisition goal rather than a revenue/profit goal.
CPA-tracking is, therefore, mainly valid for direct-to-consumer brands, and less so for retailers. For a retailer, the difference in what each person buys is huge. Buying $30 socks vs. $150 running shoes?
You can’t run the same CPA on both, so you often tend to track Return on Ad Spend instead of CPA in those cases. We’ll get to more of that in a minute.
To calculate your CPA, divide the total campaign cost by the total number of conversions. If the result is more than how much your customers are spending, that’s a clear sign that you need to evaluate your strategy.
3. Return on Ad Spend (ROAS)
ROAS is a simple, yet vital metric to keep tabs on.
ROAS is the total revenue generated (like PPC, social media, etc.) divided by the total amount spent.
Here’s the equation you use to calculate ROAS:
(Revenue/Spend) = Return on Ad Spend
You can view the ROAS for every campaign you’re running collectively, as well as the ROAS for the individual channel.
Your ideal ROAS number will depend on your margins. ROAS, when compared with other metrics like cost per lead and cost per action, helps paint the full picture of how your marketing channels are performing.
Multiple SavvyRevenue clients answered that their total ROI from digital channels was their most important KPI:
4. Average Order Value
Just as it’s important to know how much it’s costing you to grow your customer base, it’s equally as important to understand how much they’re spending.
Like I said above, if the cost of acquiring your customers outweighs the amount they spend in each order, something is off (hint: you’re losing money!).
To calculate this, divide your revenue by the number of transactions. The result is how much each customer contributes to your overall bottom line.
So what are you to do if your AOV is less than your CPA? There are several ways to approach this, but a really impactful one is to make it easy for customers to add more items to their cart before they’re about to checkout.
You know when you go to Target or T.J. Maxx, and the checkout aisles are lined with goodies like candy, snacks, candles, phone chargers, etc.? It’s a strategy to get you to buy more. The same thing can be done on an eCommerce scale.
Take this example from Madewell.
Madewell does a great job of adding personalized product recommendations to increase their customer’s AOV.
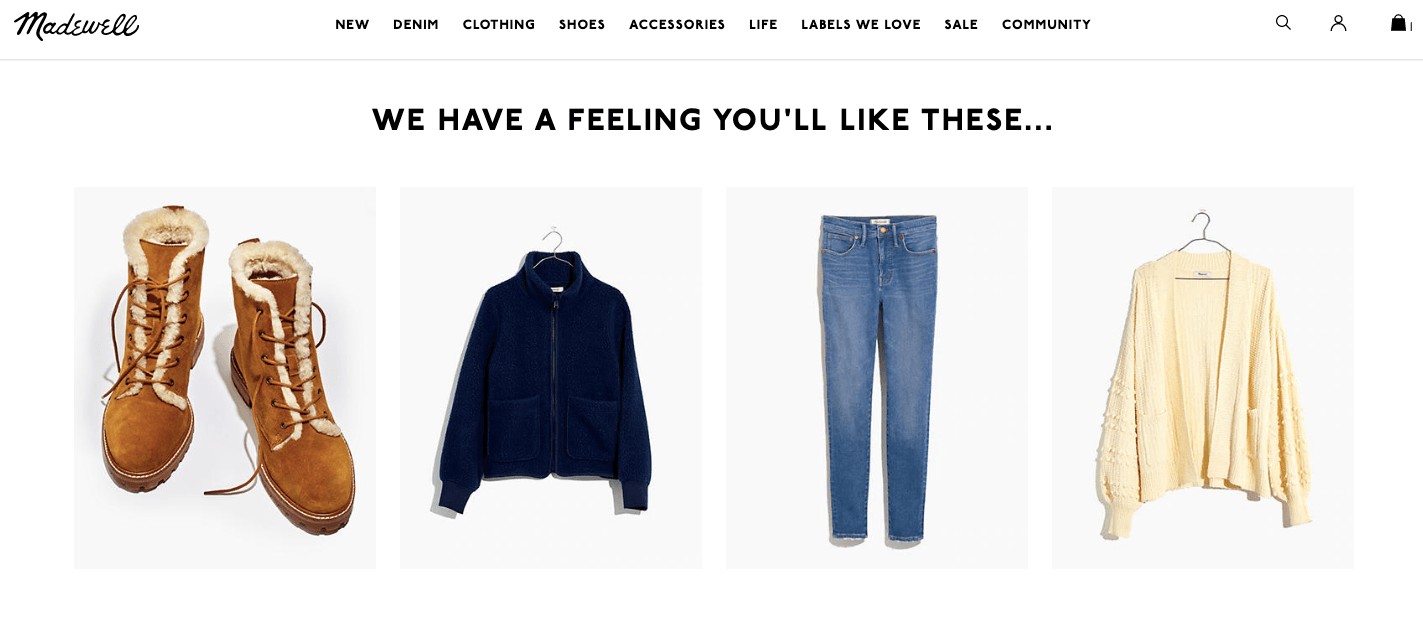
This is also a great way to make the shopping experience even better for customers; by showing them products they are likely to be interested in based on their shopping history or behavior on your site, you add a layer of personalization.
5. Time on Site
This is a metric that can help you understand if your content is resonating with your audience.
Knowing how much time people are spending on your site, and on particular pages, can be helpful for a variety of reasons:
- You can see what your most frequently visited pages are
- You can figure out what pages you need to optimize
- You can determine if the content on your site is relevant or useful to your audience
- You can include those frequently-visited pages in campaigns to give them a bigger boost
The possibilities are endless once you know what pages are clocking the most user time.
To determine this, a tool like Google Analytics is ideal.
6. Net Promoter Score (NPS)
Net Promoter Score is a straightforward question that asks customers, “How likely are you to recommend our business to a friend or colleague?”
NPS is measured on a scale of 0-10, with 0 being highly unlikely and 10 being very likely.
Why is this helpful? Well, for starters, you can understand how customers view your business—and if they’d share it with others. Second, you can understand how to improve your customer service and other touchpoints.
In layman’s terms, your net promoter score helps you improve.
So how is NPS calculated?
Customers are broken into Promoters, Passives, and Detractors based on their answer:
- Promoters: 9 or 10
- Passives: 7 or 8
- Detractors: 6 – 0
To calculate your NPS, subtract the percentage of Detractors from the percentage of Promoters.
(% of detractores – % of promoters = NPS)
Like many of the other metrics in this list, the NPS only tells you part of the story. Of course, it’s a super-helpful metric (otherwise we wouldn’t include it!), but remember: a collection of parameters helps reveal the bigger picture.
Customer reviews go hand-in-hand with NPS. By monitoring customer reviews, you can learn a bit more about how your customers feel about your product or service. Because NPS is just a number assigned to a sentiment, you can dive deeper into how your customers feel about their experience with your brand.
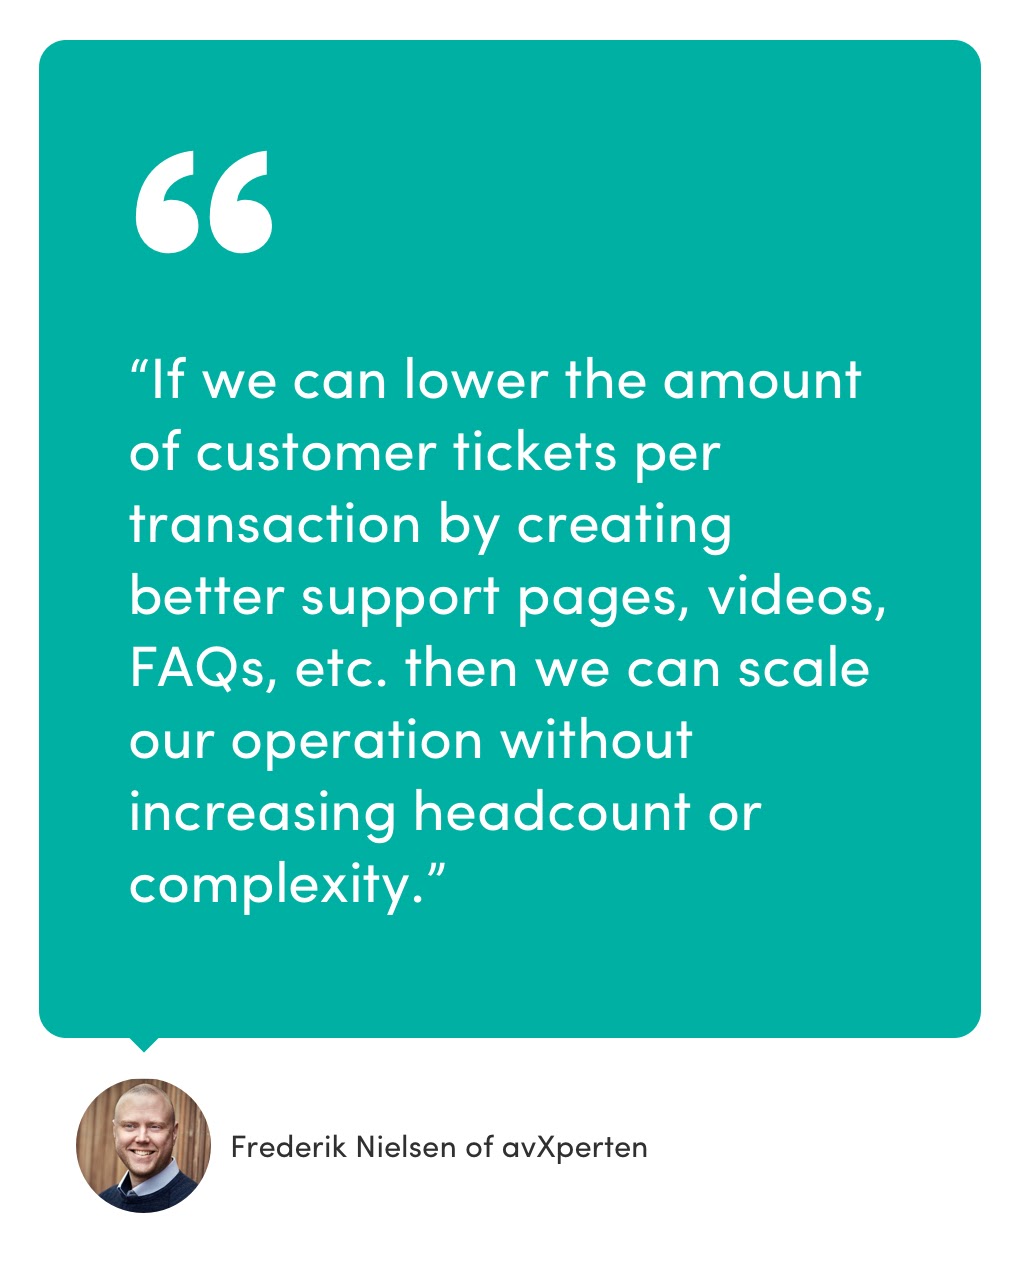
7. Tickets per Transaction
An interesting metric for any scaling eCommerce store is customer tickets per transaction.
A customer ticket can be emails, phone calls or chats. It can really be any form of customer support interaction.
Frederik Nielsen, co-founder of Danish eCommerce store, avXperten, shares:
8. Cart Abandonment Rate
Cart abandonment is something all eCommerce businesses have to deal with.
The thing about cart abandonment is that it’s not a death sentence; there are many reasons why people abandon their carts. But we’ll get to that in a minute.
Cart abandonment rate is the rate of which customers add items to their cart with the perception that they will be buying them, only to go off the site before any purchase can be made.
It can be calculated with this equation:
Cart Abandonment = 1 – (# of shoppers completing transactions / # of shoppers adding items to cart)
Did a piece of your soul die after you calculated yours? Don’t worry. In 2018, the average cart abandonment rate was 75.6%, according to Optinmonster.
That’s right. That means that 76 out of 100 shoppers are adding things to their cart, then vanishing.
So why are people abandoning their carts in the first place?
- Lack of trust
- Having to create an account
- Hidden shipping/other costs
- Complexity
- Shoppers are doing research (different stage of the funnel)
What are marketers to do? Well, there are few things actually.
Cart abandonment emails
- Emails that encourage shoppers to revisit their carts
- Make check out super easy
- Possibly include some kind of discount
Cart abandonment retargeting
- Use their behavior/shopping preferences to create ads
- Place a pixel on the checkout page, and then if a customer goes off the page, you’re able to retarget those products to them on third-party sites like Facebook and Google.
It’s essential to A/B test your cart abandonment recovery tactics to see what’s the most impactful and cost-effective. Don’t take a shot in the dark with this one, or you risk pissing off those customers.
9. Customer Lifetime Value
Customer lifetime value is the amount of money (on average) that your customers will spend with you over their estimated lifespan as one of your customers.
In other words, this metric reveals how much a business can expect to earn from a single customer based on revenue value compared to the customer’s predicted lifespan.
Your customer lifetime value tells you how well you’re resonating with your customers, how much they like your products or services, what you’re doing right, and how you can improve.
So how do you calculate this?
Let’s say one of your customers spends $100 per year on your products over five years. So that’s $500, minus any expenses that went toward acquiring that customer. Simple, right?
However, there are a few other data points that can take this metric a bit further:
- The average monthly transactions
- The average amount spent per transaction
- The average number of months your customers are loyal
- The average gross margin
Multiplying these numbers together will give you the predictive CLV.
Customer lifetime value is significant because your customers aren’t just worth the money they spend on your business today; they can be valuable to you over time.
10. Customer Churn Rate

Though it’s not the most exciting metric, your customer churn rate is a necessary KPI to track.
Customer churn rate is the percentage of customers that stopped using your company’s product or service during a specific timeframe.
Divide the number of customers within a timeframe by the number of customers you had at the beginning of that timeframe and times that with 100. Of course, any company should strive for a customer churn rate goal of 0%—or as close to 0% as possible.
So why does this matter?
You’re going to lose customers; it’s a reality of doing business.
However, it costs a lot more to acquire new customers than it does to retain current ones. According to Invesp, it can cost up to five times more to acquire a new customer than maintain an existing one.
What’s more, according to Bain & Company, retaining existing customers by just 5% can increase profits by 25%. This is because existing customers are likely to spend about 67% more on your products or services than brand-new customers.
The bottom line: reduce your churn rate; maintain the customers you worked so hard to acquire.
Don’t just track the right KPIs, take action
It’s not enough just to track these numbers; you must analyze what they’re telling you and make a plan.
The right KPIs will tell you everything you need to know about the state of your business and guide you in the right direction. It’s up to you to implement that plan.
Ensure you select KPIs that you can collect weekly without much work. Most KPI dashboards fail because they aren’t updated, or you can’t trust the data.
")
")
")
")
")
")
1 thought on “10 eCommerce KPIs You Should Be Tracking For Growth and Why”
Very interesting and thanks for sharing such a good blog. Your article is so convincing that I never stop myself from saying something about it. You’re doing a great job. Keep it up.