Most PPC managers are asking Claude the wrong question. They come at it with the prompt, “How can I get AI to do Google Ads for me?” and I think that’s entirely the wrong promise, at least for the kinds of accounts we run.
Sure, I could probably ask Claude to change a ROAS target, and it might even work. But that simple action isn’t where the value is. And if I try to scale that by asking it to adjust targets across an entire account, I suddenly have a trust problem. I have to blindly trust that it executes the same way every single time, even when the underlying model gets a silent update (Opus 4.6 → Opus 4.7 anyone?). That’s not a risk I’m willing to take with client money.
This isn’t where Claude has changed how I work. The real value is in all the work around the account: analyzing data (I’m out of spreadsheets completely), finding hidden patterns, creating visuals, and handling the repetitive tasks that used to drain hours from my week. This article is about using AI to give you superpowers.
A plane can’t get to the moon, but it can if you put rocket boosters on it. That’s how I think of AI. It’s my rocket booster. I can do things I’ve never been able to do before. Here are the AI workflows that have actually survived inside our agency.
Go beyond the article
Why the video is better:
- See real examples from actual accounts
- Get deeper insights that can’t be conveyed in writing
- Learn advanced strategies for complex situations
My Core Rule: Claude Informs Me, It Never Acts For Me
I don’t use AI for automation; I use it for augmentation. I don’t want an AI co-pilot touching bids and budgets. I want an AI research assistant that processes more data than I ever could manually, so I can make faster strategic decisions.
By keeping the AI on the analysis side of the fence, I get its processing power without its errors or lack of context. I’m still the strategist, I just have better tools now.
Workflow #1: Data Ingestion and Analysis (But Never Conclusions)
This is my most frequent use case for Claude. It has completely replaced the need for complex spreadsheets when it comes to finding correlations in data.
What I use it for
I upload a CSV and provide a straightforward prompt.
Context: The data I’ve uploaded is from a Google Ads account. Our concern is ABC, and our goal is XYZ.
Data explanation: This CSV has A, B, and C columns, with XYZ per row.
Request: Now, as simply as possible, review the data points and give me [specific output].
Here are two real-world examples.
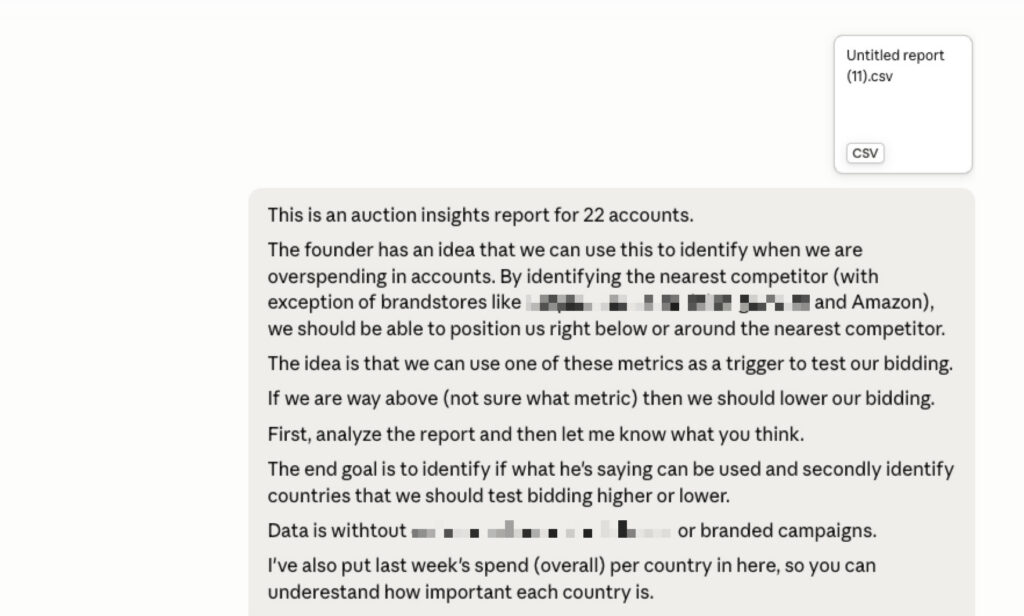
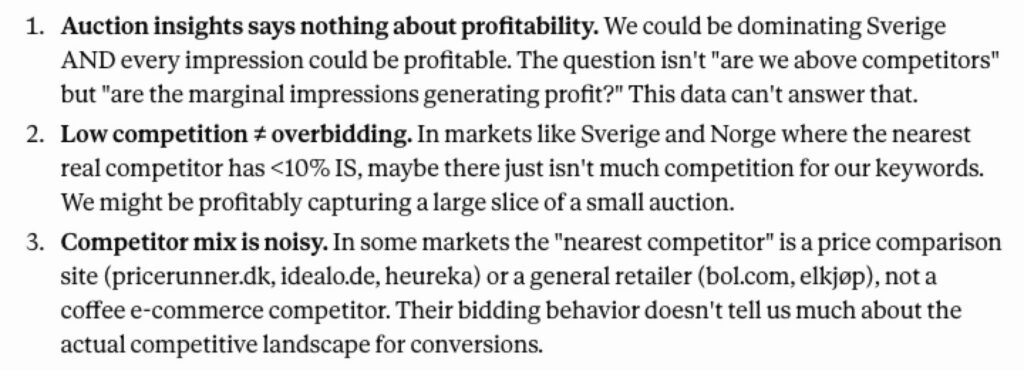
In one case, we were trying to find any data that could help us predict if we were about to over- or underspend. After feeding Claude three months of performance data segmented by day, the result was clear: not a single data point could be reliably correlated to predict future spending swings. That conclusion, which might have taken hours of pivot table manipulation, took about five minutes to confirm.
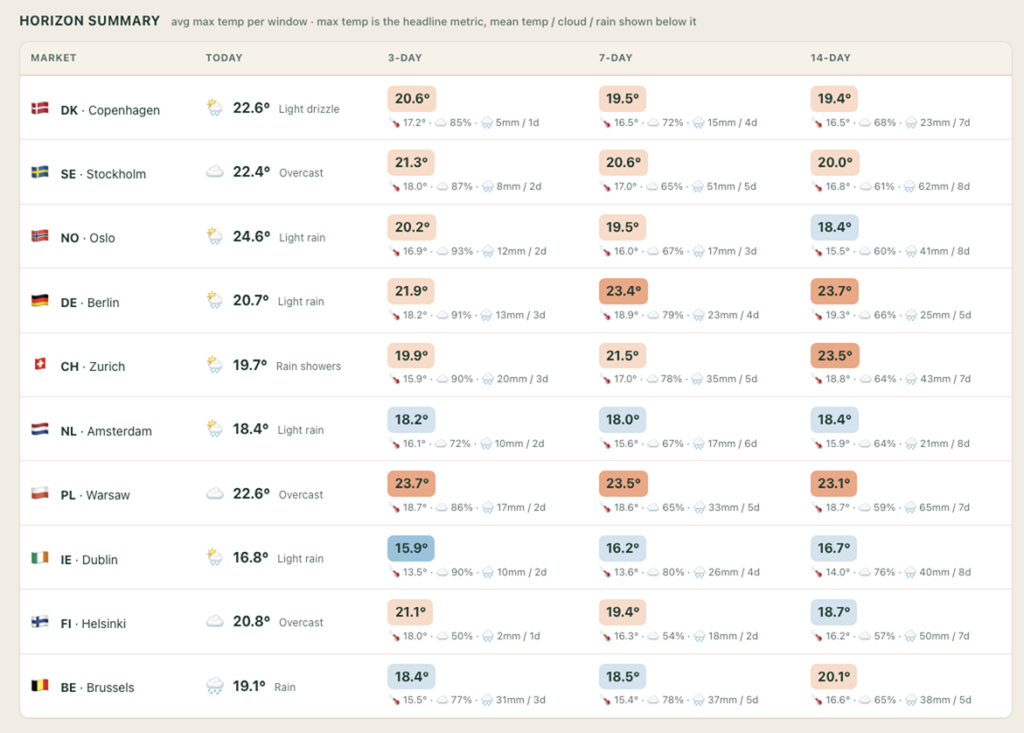
In another, a client’s performance was starting to trend behind last year’s revenue curve. I was concerned about the weather. I uploaded our YoY performance data and asked Claude to review weather data for the same period. The prompt was direct:
“Analyze the weather in Europe in May 2024 versus May 2023. Focus on Denmark, Sweden, Norway, Germany, and Switzerland. Explain whether lower temperatures this year could be a reason we are seeing lower revenue YoY.”
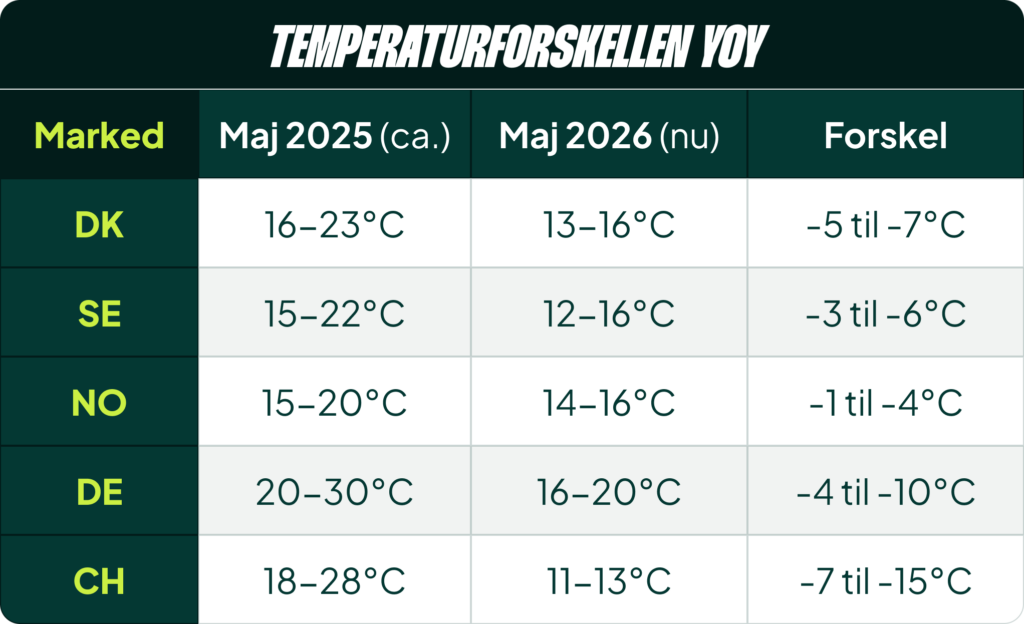
In minutes, I had a conclusion. The weather was significantly colder this year. This was something we used to build complicated spreadsheets for with weather APIs that we had to manually read and interpret. It worked, but it was a 30-minute process. Now it’s a 5-minute check.
Where I don’t trust it
There’s one dealbreaker. You must explicitly tell Claude not to conclude anything on the data. Left to its own devices, it has a tendency to pull conclusions out of thin air to be “helpful.”
For instance, you’ll see spend decreasing and ROAS increasing, and Claude will say: “You’re clearly aiming to be more efficient, and your hard work is paying off.” Nope. The reality is we’re struggling to find volume.
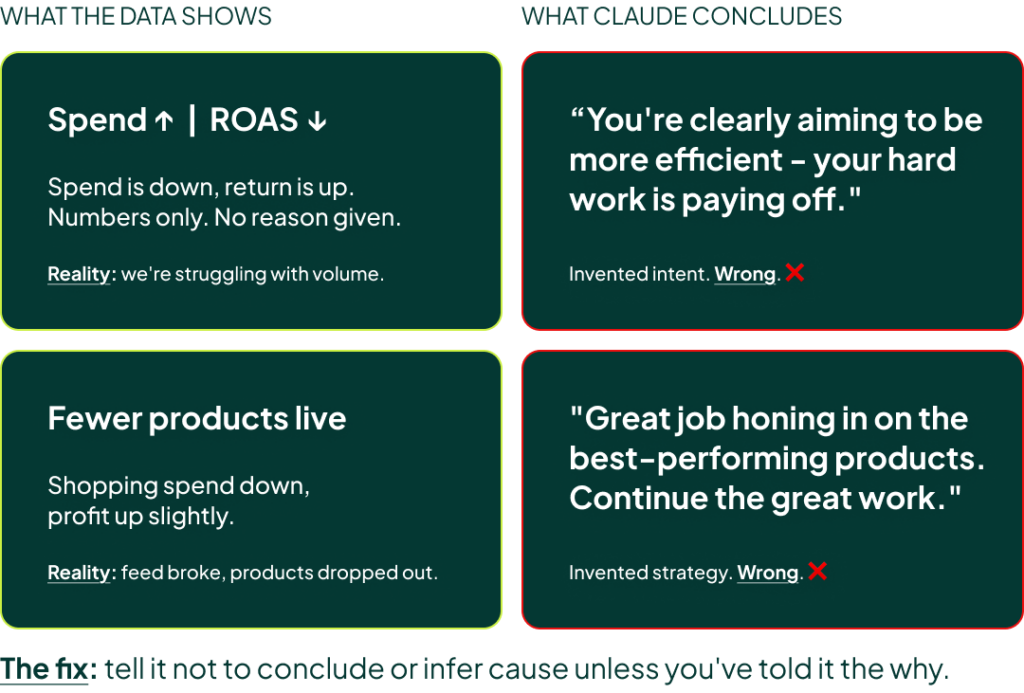
Or you’ll see fewer products active in Google Shopping and decreasing spend, and Claude will say: “Great job honing in on the best-performing products!” Nope. We want more volume, and performance is suffering.
You get the idea. It’s just filler. I specifically instruct it not to create any conclusions or infer what actions or strategies have led to the data being what they are.
Workflow #2: My On-Demand Data Dashboard
Data visualization has become my favorite way to use Claude. The problem with any pre-built dashboard software is that it runs into one of two issues:
- It’s too simplistic to be useful for deep analysis.
- It’s overly complicated because it tries to work for every possible scenario.
My solution has been to use Claude as my data dashboard for one-off analyses. We created a simple skill with some basic context: keep visuals simple, show 1-2 metrics at a time, and don’t write any text. Now we can just upload data and ask for a visual of it.
Case Study: Uncovering Hidden Spend Shifts
I was looking at an 8-week period for a client where we couldn’t seem to improve the Blended ROAS, despite lowering spend and trying different things. I uploaded all the relevant data points and asked Claude to visualize them.
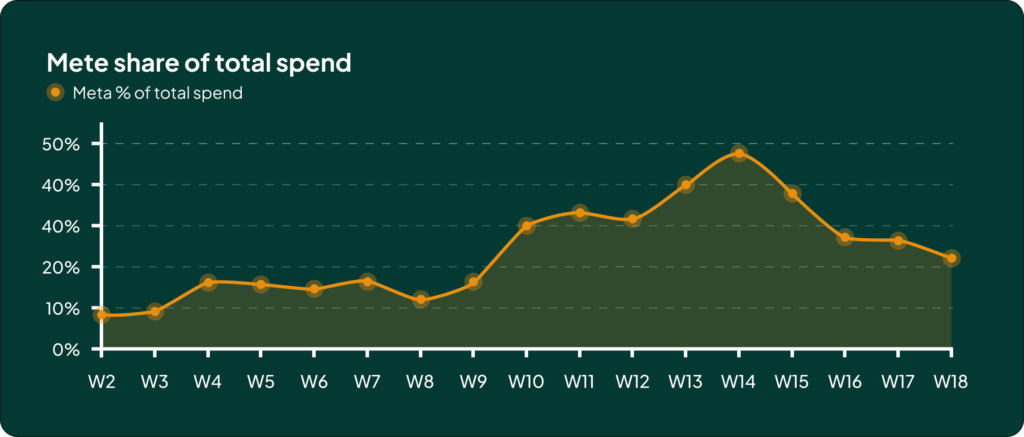
As I scrolled through the graphs, one thing stuck out: the Meta spend percentage in Poland was much higher than in other countries. It turned out the client had missed communicating that they were pushing Meta harder in this country as a trial. Coincidentally, as we decreased spend on Google, their Meta budgets had been increased. It was a simple communication gap that a visual made immediately obvious.
Case Study: Rapid YoY Account Audits
For another task, I ingested performance data for the first four months of the year for all our accounts, along with the numbers from last year. I then asked for simple overviews: an aggregated view per campaign type, and an aggregated view per account per campaign type, sorted by the YoY difference in spend.
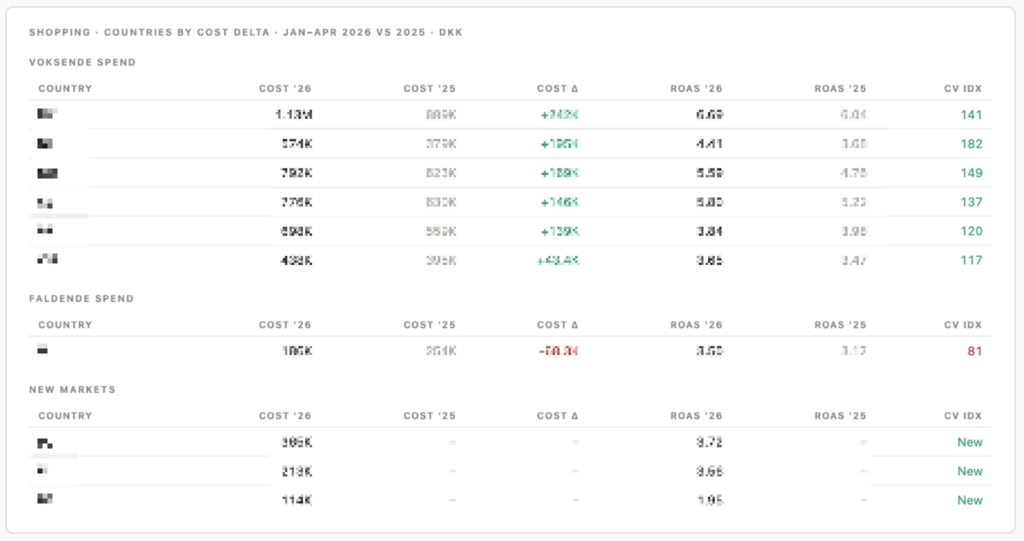
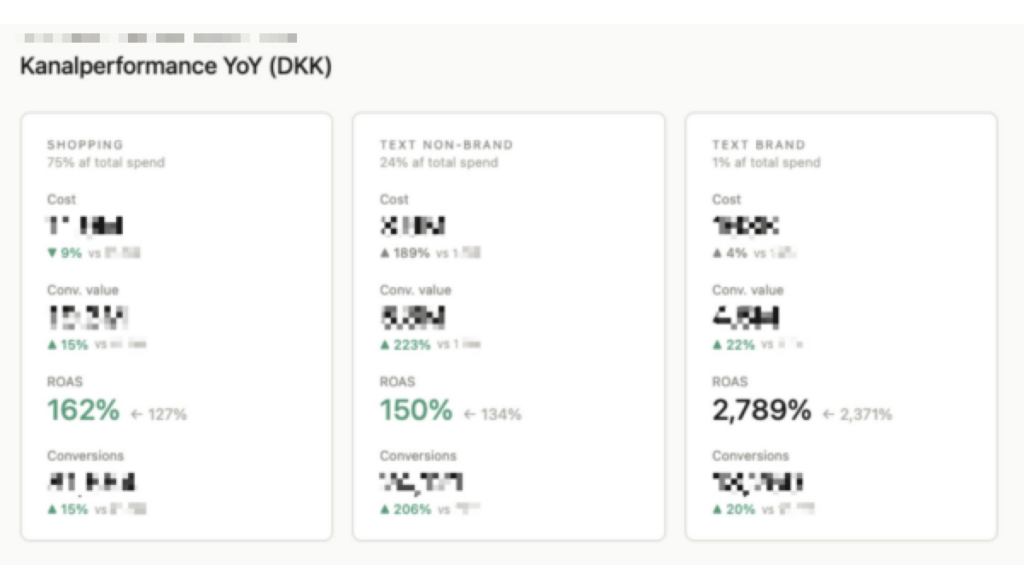
The visuals let me flag two things for the team instantly:
- Search was outpacing Shopping in terms of improvement, and had grown from less than 10% to over 20% share of spend.
- I quickly identified five specific accounts that were significantly underspending YoY.
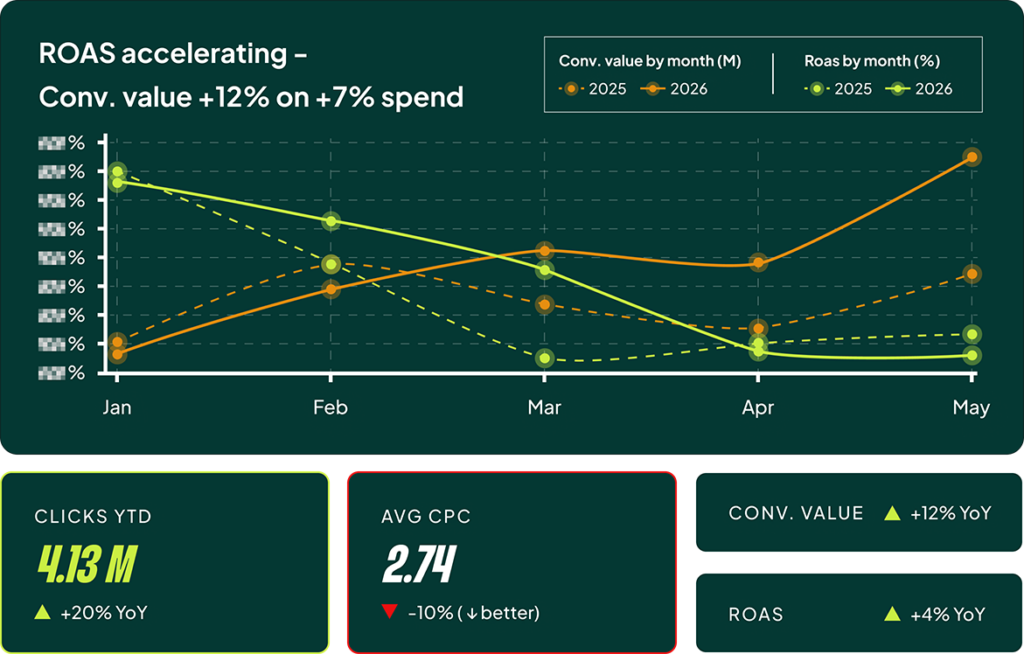
Understanding data through visuals is underrated. It bypasses the tedious spreadsheet work and helps you tell a story with data, both for yourself and for your clients.
The Real Value is Augmentation, Not Automation
If you’re looking for AI to do your job for you, you’re going to be disappointed. The promise of full automation in a domain as complex as Google Ads is still a long way off.
But if you approach it as a tool to augment your own expertise, it works. Claude handles the grunt work of data processing and visualization, and I handle the strategy. That’s the rocket booster in practice.
[TL;DR]
- Use AI to give you superpowers for the work around the account, not to do your job for you.
- Use Claude for data ingestion and analysis to find correlations quickly, but explicitly instruct it not to draw any conclusions on its own.
- Claude is an excellent on-demand visualization tool. Use it to create one-off dashboards that help you see patterns and tell stories with data you’d miss in a spreadsheet.
- My core rule is that AI can inform my decisions, but it never gets to act on them. The strategist (you) must always remain in control.