
Most advertisers write Responsive Search Ad headlines once and never look at them again. That’s a problem. For years, we were flying blind, but Google has finally given us individual headline performance data: click-through rate, conversion rate, and ROAS for every single headline.
The question is, what do you do with this data? How do you actually test your headlines in a way that doesn’t consume all your time?
In this article, I’m going to show you the exact system I use to identify which headlines are winning, which are failing, and most importantly, why they’re failing so you can write better iterations and improve performance. The core of it is a simple performance matrix with four quadrants.
Go Beyond the Article
Why the Video is Better:
- See real examples from actual client accounts
- Get deeper insights that can’t fit in written format
- Learn advanced strategies for complex situations
The Problem with How Most Advertisers “Test” RSAs
Before we get into the system, we need to address the root issue. Most people open Google Ads, see 15 empty headline slots, and think their job is to fill all of them. They end up writing the same thing 10 to 15 different ways.

You’ve seen it before:
- Big Selection
- Big Selection Here
- Best Prices
- Best Prices Online
- Shop Now
- Shop Online Now
You’re not really testing anything. You’re not feeding the responsive search algorithm meaningful variations. You’re just checking all the boxes, thinking you’re getting an A for effort, but you’re not putting the right answer in any of the boxes. This has to stop.
A Better Foundation: Stop Writing Random Headlines
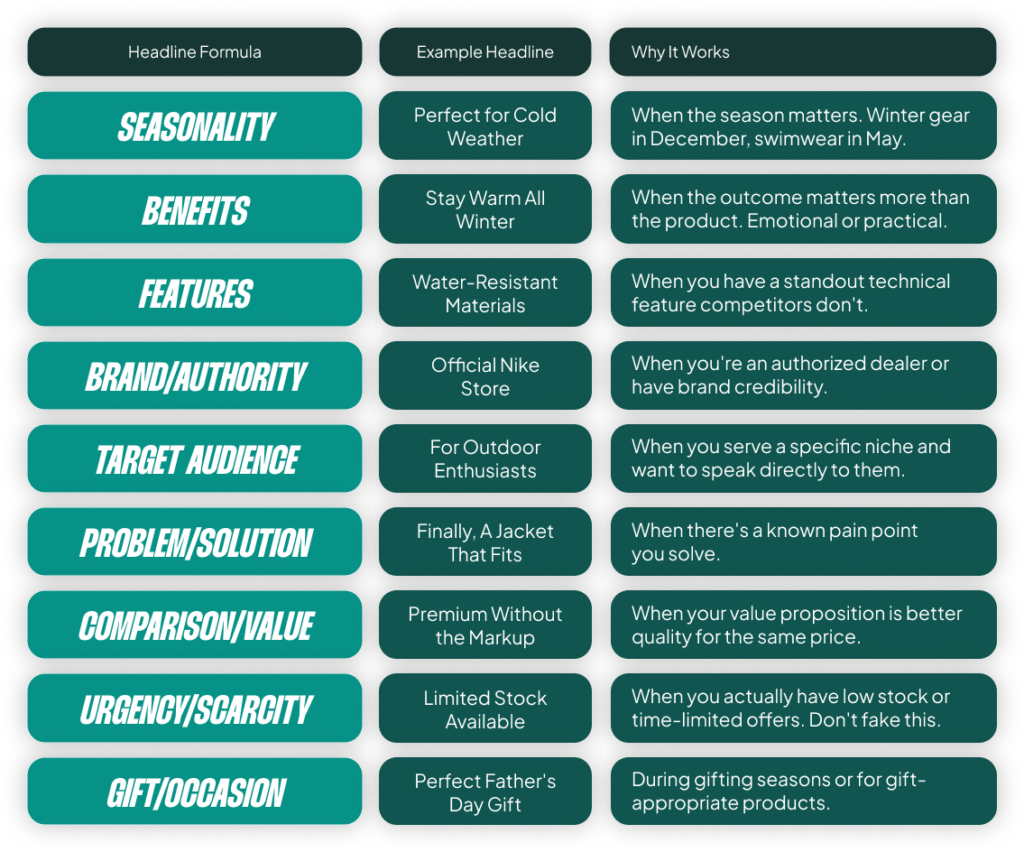
The goal is to stop writing random headlines and start testing specific formulas more deliberately. In a previous video, I detailed a framework with 14 headline formulas, but the core idea is simple: you need structure.
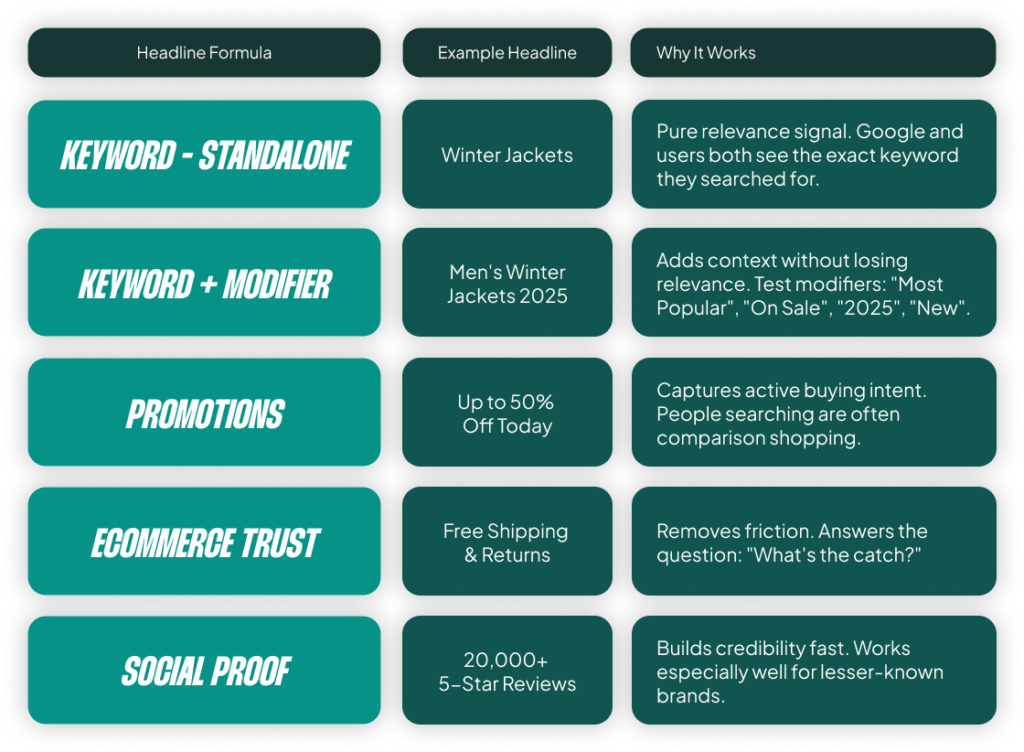
Every responsive search ad should start with what I call the “Core Five” formulas. These are non-negotiable, and every ad should have at least one headline from each category. Most of the time, these five are also your best performers.
The Core Five formulas are:
- Keywords: Directly matching the user’s search.
- Benefits: What outcome does the user get?
- Trust Builders: Why should they believe you? (e.g., reviews, years in business)
- Features: Specifics about the product.
- Call to Action: What should they do next?
If you only did one thing differently, using just these five formulas would make your ads clearer and infinitely easier to optimize. Writing with constraints is one of the most powerful things you can do. Instead of a blank page, you have a specific job for each headline.
How to Find the Headline Performance Data in Google Ads
Not everyone knows where to get this data, so let’s quickly cover that. It’s buried a bit, but easy to find once you know where to look.
Here’s how to access it:
- Navigate to Campaigns > Assets.
- In the table view, click Asset type and select Headline.
- I recommend filtering down to a specific campaign to get cleaner data.
- Click on Columns, remove everything, and then add the following: Clicks, CTR, and Conversion rate.
That’s it. Now you have a clean view where you can sort by clicks and easily see the CTR and conversion rate for each headline. Now we can actually interpret this data.
The Performance Matrix: How to Interpret Your Data
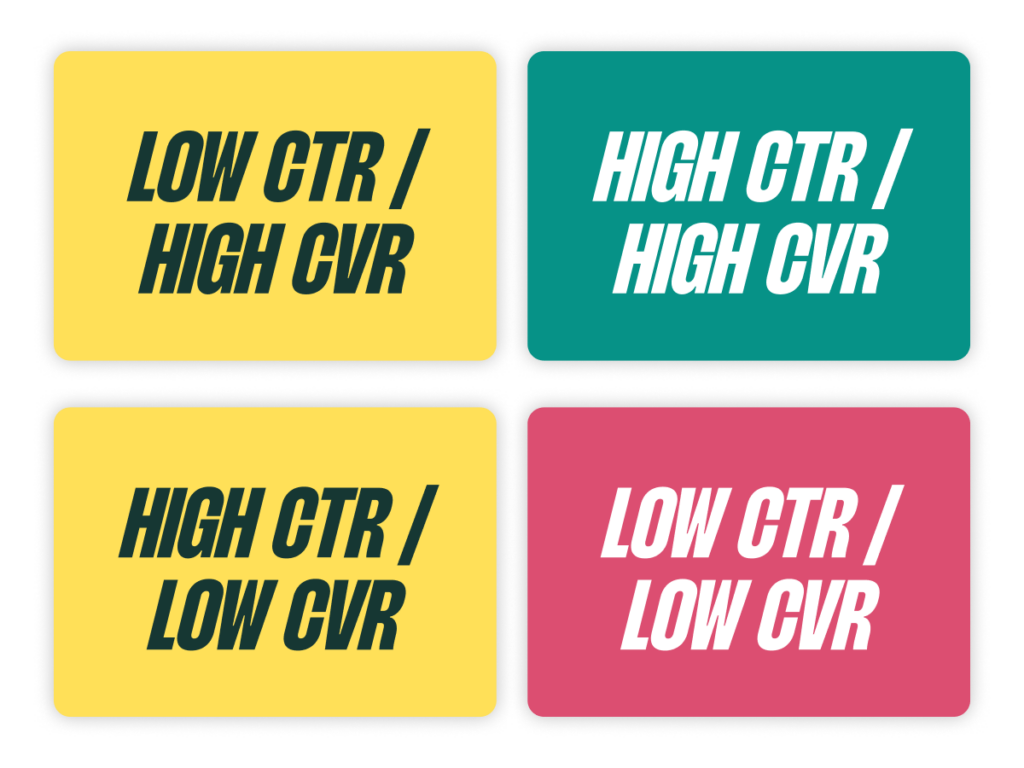
I use a simple matrix to group headlines into four quadrants based on their click-through rate (CTR) and conversion rate (CVR). The goal is to figure out what we should do with each headline to move it into the top-right quadrant.
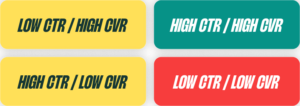
The four quadrants are:
- High CTR / High CVR: The Winners.
- Low CTR / High CVR: The Hidden Gems.
- High CTR / Low CVR: The Money Pits.
- Low CTR / Low CVR: The Losers.
By categorizing your headlines this way, you immediately know where the problems and opportunities are.
What to Do With Your Headlines (Based on the Matrix)
Now that you know which headlines are failing and why, here’s what to do about it.
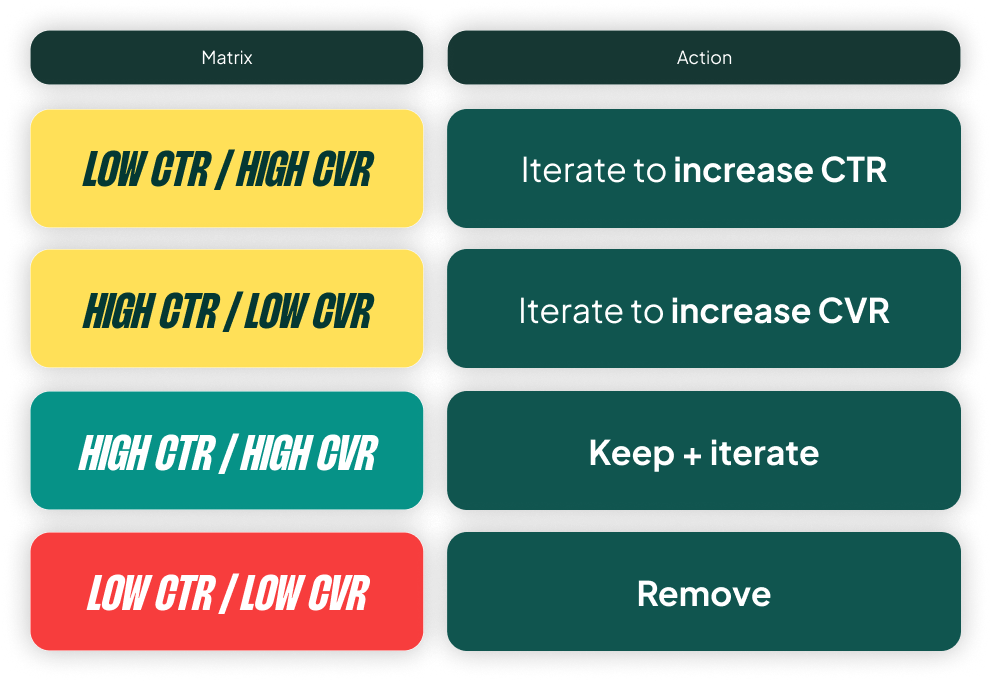
Low CTR / High Conversion Rate
This headline has a powerful message, but it’s not attractive enough to get the click. Something in it resonates deeply with the people who do click. Your job is to increase the CTR.
For example, we had a headline that said “24-Hour Shipping & Free Exchanges.” It had a great conversion rate but a low CTR. My experience told me the key driver was the fast shipping, while “free exchanges” is just table stakes in that industry. A better iteration would be to simplify it to just “24-Hour Delivery.” This removes the fluff that could be lowering the CTR.
High CTR / Low Conversion Rate
This is often the most dangerous quadrant. You’re getting a lot of clicks, but they aren’t converting. This means you’re likely getting unqualified traffic. The problem is either a mismatch between the ad and the landing page, or you’re not filtering out the wrong people.
If your ad says “Free TV with every purchase” and that’s not on the landing page, you’ll get a high CTR and a terrible conversion rate. To fix this, iterate on the headline to add qualifiers. Mention the price point, brand type (premium vs. budget), or a key feature to ensure the right people are clicking.
High CTR / High Conversion Rate
These are your winners. Keep them. But don’t just leave them alone. Always try to write new variations to see if you can make them even better. Don’t just focus on fixing your poor performers.
Low CTR / Low Conversion Rate
This one is simple: just remove them. They are dead weight. They aren’t getting clicks, and the few they get don’t convert. Kill them to make space for new tests.
A Critical Caveat: Your Account Goal Changes Everything
The action you take depends entirely on your current business goal. The matrix is a tool, but your strategy dictates how you use it.
- If your goal is PROFITABILITY: You need to prioritize conversion rate. Any headline with a low CVR should be removed, even if it has a high CTR. Those high-CTR, low-CVR headlines become “remove” instead of “iterate.”
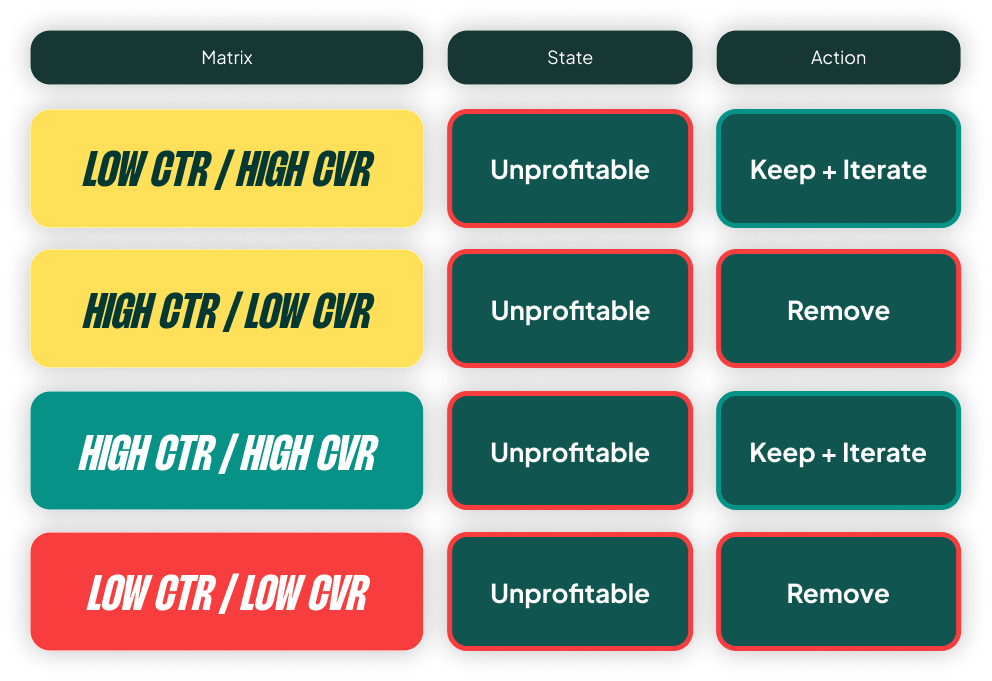
- If your goal is SCALE: You need to prioritize click-through rate. In this case, you’d keep the high CTR headlines (even with lower CVR) and work to improve their conversion rate. You’d be more aggressive about removing anything with a low CTR.
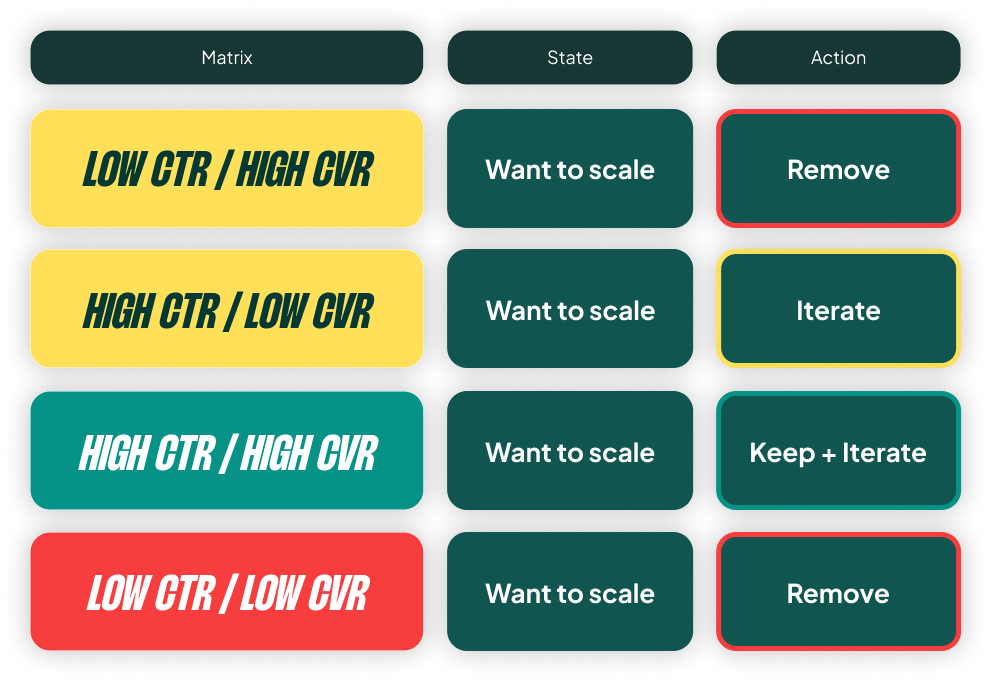
Your state of the account dictates whether you go one way or the other.
The Complete 5-Step Quarterly Workflow
If you want to do this systematically instead of randomly replacing failures, here’s the full workflow.
Step 1: Start with the Core Five.
Write one headline for each of the five core formulas. Only five. Run them for at least 30 days to get enough data on each one.

Step 2: Analyze Performance After 30 Days.
Come back and check which formulas get the highest CTR and conversion rate. Put each headline into the performance matrix. This is where your assumptions get tested. I’ve seen businesses built on “Danish Design” be flabbergasted when those headlines perform the worst. That’s why we test.
Step 3: Iterate on Your Winners.
Once you know which formulas work, test variations within that formula. If “Save 20% on Pacifiers” worked, new iterations could be “Winter Sale: Save 20%,” “Save 20% on All Pacifiers,” or “Exclusive Sale: 20% Off.” You’re optimizing within a framework you already know works.

Step 4: Replace the Losers with New Formulas.
Kill the Low/Low headlines. Now, instead of just trying another Core Five headline, you can pull from the nine advanced formulas (like Social Proof or a specific Feature). If “Danish Design” worked, a feature-focused headline like “BPA-Free Silicone” might complement it well.
Step 5: Repeat the Process Quarterly.
I’m the first to admit you could do this monthly, but I also know that most advertisers are doing this never. (Yes, ever). Doing this quarterly is achievable. It ensures you’re updating ads for seasons, you have significant data to be confident in your winners, and you’re still updating promotional ads as they change anyway.
It’s Not as Complicated as It Sounds
If all of this sounds oddly complex, it’s really not. The 80/20 principle here is simple: sort your headlines by clicks, kill all the headlines with a low CTR and low conversion rate, and test new versions.
If that’s all you do after reading this article, you’re still way ahead of most advertisers.
The key insight is that you’re not testing random headlines anymore. Adding 15 similar, random headlines actually hurts your performance because the algorithm doesn’t know what to do. This system works. If you do this quarterly, you’ll write better ads than 90% of advertisers out there. Just start today. Pick one campaign, write five core headlines, and come back in 30 days to see what the data says.
[TL;DR]
- Stop writing 15 random, similar headlines. Start with five distinct headlines based on the “Core Five” formulas (Keywords, Benefits, Trust, Features, CTA).
- Use the Asset report in Google Ads to analyze the CTR and Conversion Rate for each individual headline.
- Use a four-quadrant matrix (CTR vs. CVR) to diagnose what’s wrong with underperforming headlines and decide whether to iterate or remove them.
- Your account goal (Profitability vs. Scale) determines your optimization strategy. Prioritize CVR for profit and CTR for scale.
- Implement a simple, quarterly workflow: Start with the Core Five, analyze after 30 days, iterate on winners, and replace losers with new formulas.
")
")
")
")
")
")