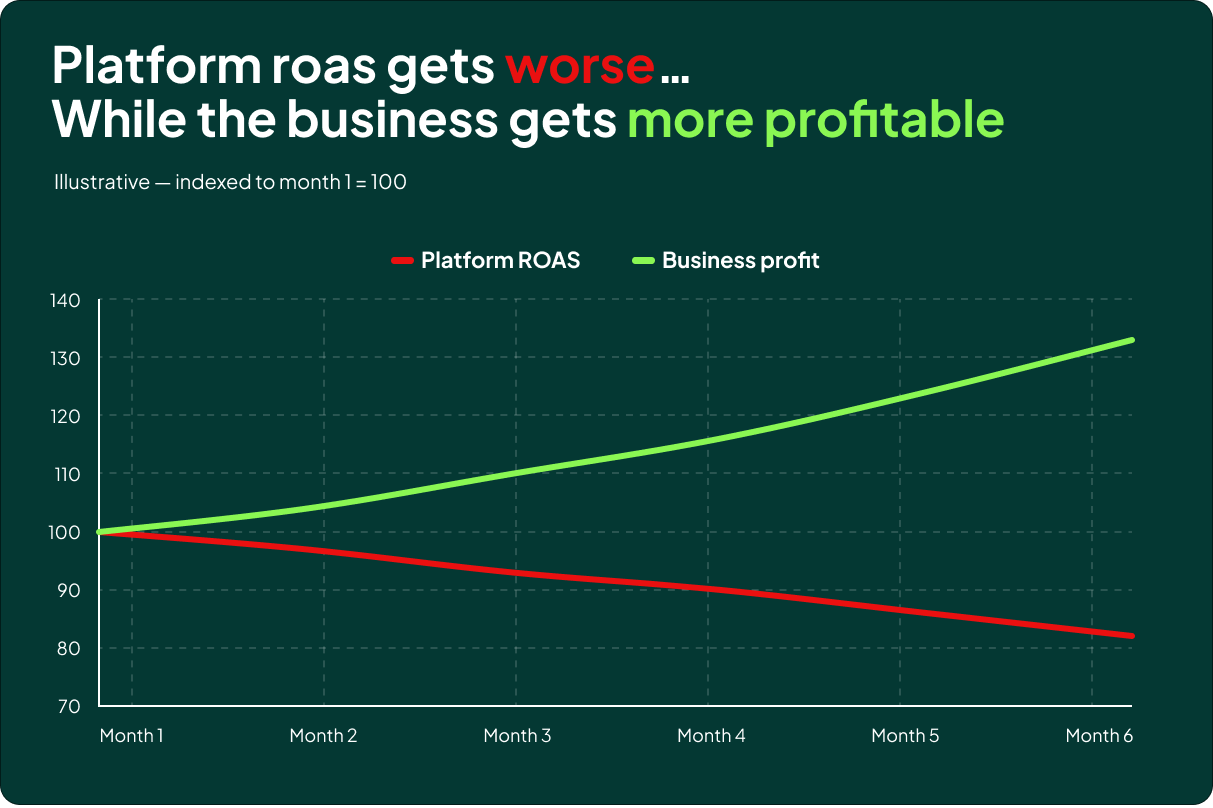
Your Google Ads ROAS can get worse while your business becomes more profitable. It can also improve while your business goes backwards. Both happen more often than most advertisers want to admit, and both are symptoms of the same problem: the number you are optimising towards is no longer a reliable description of reality.
Platform ROAS still has its uses, but it cannot be your source of truth anymore. And once you accept that, you need something else to steer by. For us, that something is Blended ROAS.
This article is the framework we have implemented with 9 out of 10 advertisers at SavvyRevenue. It covers what Blended ROAS actually is (and, more importantly, what it is not), how we use it to find the correct in-platform bidding target, and how we use it to review performance on a daily and weekly basis without waiting for attribution to catch up.
Go beyond the article
Why the video is better:
- See real examples from actual accounts
- Get deeper insights that can’t be conveyed in writing
- Learn advanced strategies for complex situations
Why Platform ROAS Stopped Being Trustworthy
Tracking is becoming less dependable, and it comes in two forms.
The first is technical. Browsers keep blocking trackers, cookie lifetimes keep shrinking, and the volume of conversions you can actually observe keeps falling.
The second is the platforms’ response to the first: modeled data. Modeled data is estimated on a model, and models get updated. So not only can your tracking change as browsers make changes, the platform’s compensation for those changes can also change.
I have seen this play out several times over the last few years. Performance in the account suddenly improves. Reported ROAS jumps. Nothing in the business looks any better. Revenue is flat, contribution margin is flat, and the only thing that actually changed was how Google decided to model the data.
If you are making bidding decisions on that number alone, you are making decisions on a moving measuring stick.
What Blended ROAS Can and Cannot Do
Before I explain how we use Blended ROAS, let me be clear about what it is not, because this is where most people get it wrong and then blame the metric.
Blended ROAS is not attribution. It will not tell you which channel earned the sale. It is not budget allocation. It will not tell you exactly how much to invest where.
You cannot use it on a campaign level, and you certainly cannot use it on an ad group or asset group level.
It can give you false positives.
And used badly, it can quietly push you to deprioritize long-term investments (brand, new markets, top-of-funnel) because they look inefficient in a single-month view.
Your job is to use Blended ROAS as a rudder, not the end all, be all truth. It does not point you towards a destination. It keeps you from drifting away from one.
YES, this was my analogy. Not AI. So blame me. Not AI.
The Three Metrics You Need to Define First
Most confusion around this topic comes from people using the same words to mean different things. So here are the three metrics in this framework, with their denominators clearly separated:
- Platform ROAS (or POAS): What Google Ads reports and optimises towards. In our own examples we often use POAS rather than ROAS, but the framework is identical either way.
- Blended ROAS: Total business revenue divided by total ad spend across all channels. This is your business-level source of truth.
- Google Total ROAS: Total business revenue divided by Google Ads spend only. This lets us evaluate Google Ads without changes in Meta, TikTok or affiliate spend distorting the denominator.
That third metric is the one most advertisers skip, and it is the one that does the heaviest lifting in daily reviews. If your Blended ROAS drops because someone doubled Meta spend last Tuesday, Total ROAS will tell you that Google was never the problem.
The Two Jobs of Blended ROAS
At savvy, we use Blended ROAS for exactly two purposes.
The first is strategic target setting. We use it to challenge whether our in-platform ROAS target is holding back profitable growth.
The second is day-to-day performance reviews. We use Blended ROAS and Total ROAS to monitor whether Google Ads is producing the business performance we expect.
The first helps you find the right bidding target (continuously). The second helps you operate the account once you have found it.
Let’s start with the first one.
Job One: Find the Correct ROAS Target
The framework has three steps: get your current Blended ROAS, challenge your ROAS target, and monitor the impact over one to three months.
- Get to your current Blended ROAS (Baseline)
- Challenge your ROAS target
- Monitor impact over 1-3 months
Step 1 – Establish your baseline
The goal here is simple. You want to know what your current in-platform ROAS targets actually correspond to at a business level. Do this:
- List your platform ROAS (or POAS) per month.
- List your Blended ROAS per month (all ad spend versus all revenue).
- List your Total ROAS per month (Google Ads spend versus all revenue).
- Separate the periods that do not represent normal trading conditions, such as Black Friday and Christmas.
- Ask AI (or a spreadsheet, if you prefer doing it the honest way) to calculate the typical correlation.
- Use the resulting Blended ROAS and Total ROAS figures as your initial targets.
Six to twelve months of data is enough. You are looking for an operating range rather than a single magic number. For example: a 138% POAS target in the platform has historically corresponded to roughly a 580% Blended ROAS. That is your reference point.
Step 2 – Challenge the target
Once you know what your in-platform target corresponds to, you can start testing whether that target is still the right one. There are a few levels at which you can do this:
- Overall, excluding brand: the best place to start.
- Search versus Shopping: lowering the Search target often opens up new audiences and is frequently a net positive.
- Segments within Shopping: bestsellers, specific categories, margin tiers.
I strongly recommend starting with the entire account (minus brand). Almost everyone who attempts this exercise makes the same mistake: they do not make a big enough change.
If 30% of your revenue comes directly from Google Ads, and you change the target on 10% of your Google Ads spend, you are influencing roughly 3% of total business revenue. Even an excellent improvement is statistically invisible at that scale. You will look at your Blended ROAS, see noise, and conclude that nothing happened.
Make the change large enough to be readable in the total business. In practice, we reduce the in-platform ROAS target by around 20% in the campaigns or segments we want to challenge. And in 8 out of 10 cases, we find that we can lower the target, increase spend meaningfully, and see a minimal drop (if any) in Blended ROAS and contribution margin.
Step 3 – Monitor over one to three months
Do not measure this over two weeks. One month minimum, three months preferably.
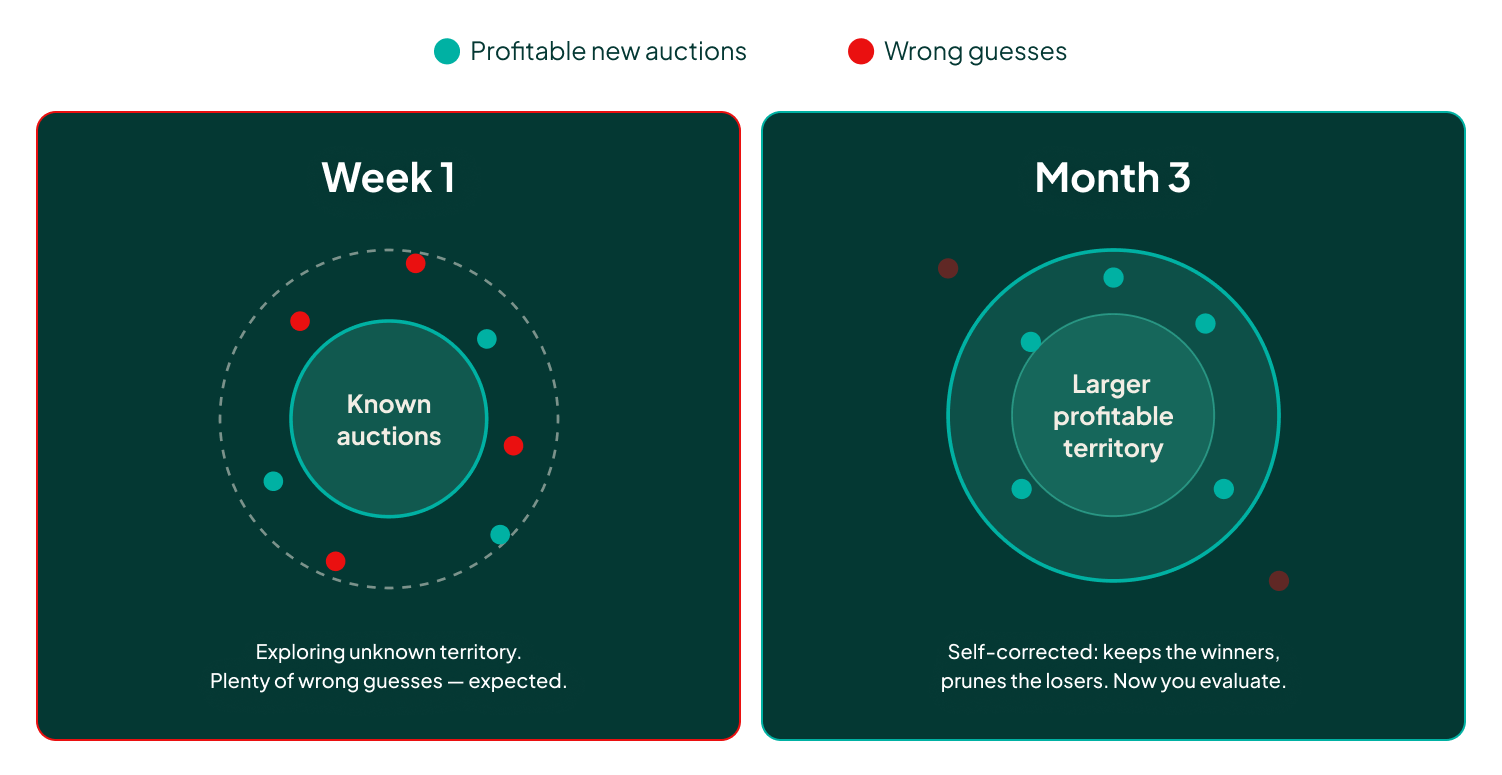
When you lower the ROAS target, the platform enters new auctions to see what it can get.
Contrary to what a lot of people believe, Smart Bidding cannot predict with any certainty in auctions it has no history in.
It guesses, gets some of those guesses wrong, and then self-corrects as data comes in. If you read the results in week one, you are reading the wrong guesses.
After one to three months, read the results in this order:
Google Ads spend → Platform ROAS → Total ROAS → Blended ROAS → Contribution Margin
You can counter-argue that contribution margin could have improved for other reasons. That is true, and it is why you cannot run this test in a vacuum.
You need to know what else is going on in the business: promotions, stock, pricing, new product launches, other channels.
The seven-step plan
- Pull the data. Export 6 to 12 months of platform ROAS or POAS, revenue, total ad spend and Google Ads spend.
- Find the baseline. Separate abnormal periods and identify the normal ranges for platform ROAS, Blended ROAS and Total ROAS.
- Choose a meaningful test. Make sure the change covers enough Google Ads spend to move the total business.
- Lower the target. Reduce the in-platform ROAS target by roughly 20% in the campaigns or segments you want to challenge.
- Let it run. Give Smart Bidding time to adjust and monitor for one to three months.
- Evaluate the business. Compare revenue growth, Blended ROAS and contribution margin, and do not stop at platform ROAS.
- Make the decision. Keep or expand the change if the business outcome improves. Reverse or narrow it if you are only spending more without creating growth or profit.
Job Two: Use Blended ROAS for Daily Performance Reviews
Once you have found the correct platform ROAS, Blended ROAS and Total ROAS targets, the same metrics become what you measure daily.
The problem with platform ROAS on a daily basis is that it takes too long to get the data.
Conversions are reported when the sale happens, so today’s number is not today’s number. It can take days to settle.
Spend and backend revenue, on the other hand, are available almost immediately. Which means Total ROAS lets you review performance without guessing about conversion lag.
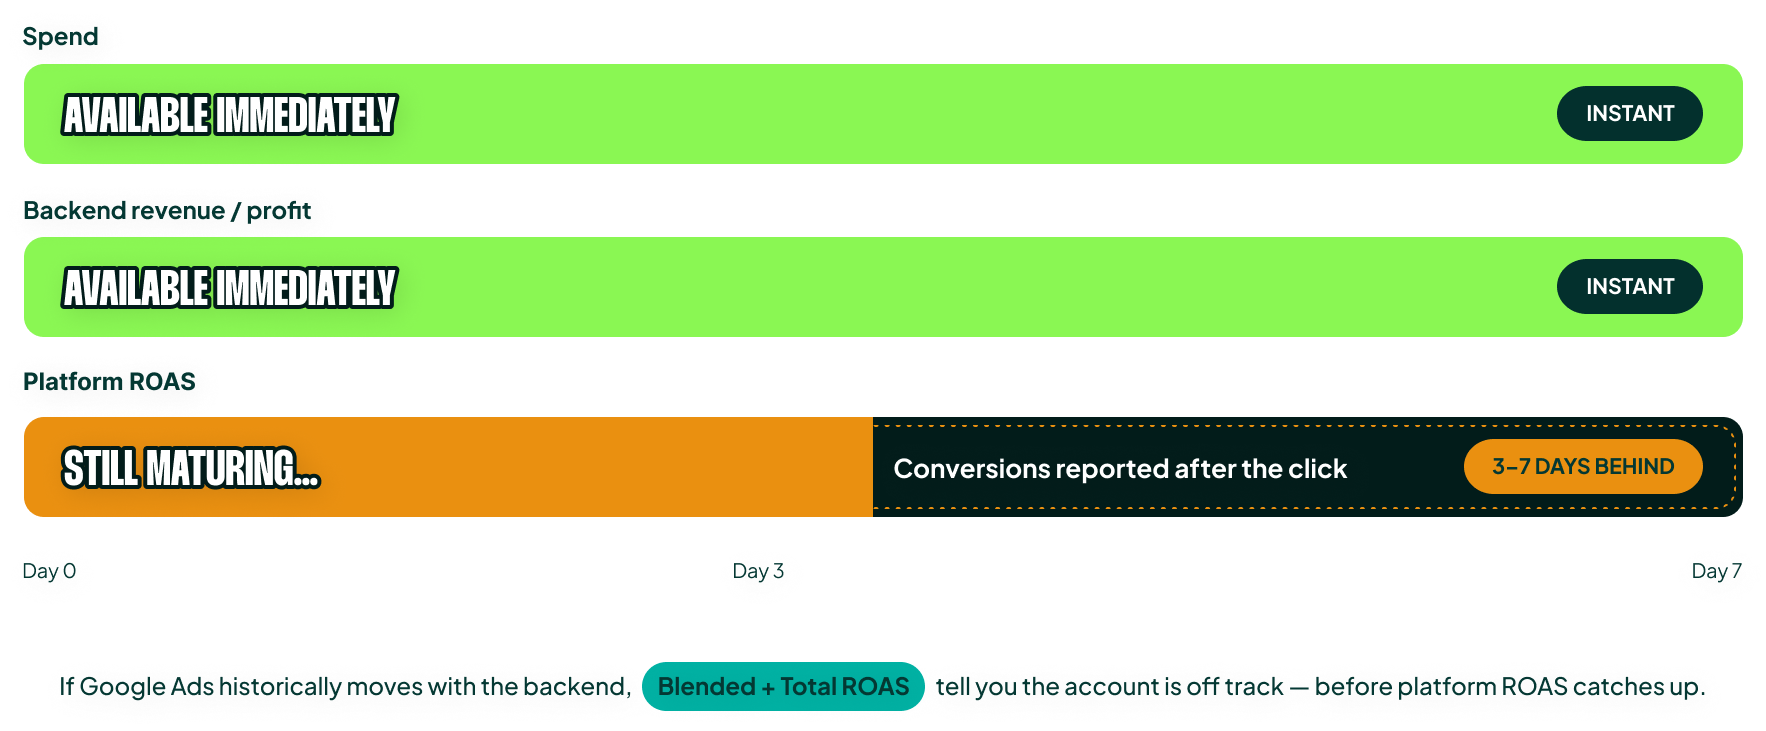
This does three things for you:
- It catches performance drops early instead of forcing you to wait for attribution to mature.
- It catches tracking changes early, because backend revenue is not modeled and is therefore safer to trust.
- It shows you whether spikes in spend actually correlate with spikes in revenue, which is the single best defence against the yo-yo effect of raising and lowering targets on bad data.
Now, there’s an important aspect here which is you don’t take action on a single day’s performance, unless those single days are way out of the norm. Think Black Friday, or the day after eCommerce cut off before Christmas, so what we’re actually measuring and taking action on is 2 to 3 days’ performance and not intraday performance.
Build the dashboard
One of the best things we have done at Savvy is build dashboards that combine Google Ads numbers with business numbers in one view: traffic, ad spend, platform ROAS, Blended ROAS, Total ROAS and year-over-year backend growth.
This lets us continuously correlate what the account says with what the business says. It makes for better decisions, obviously. But there is a second benefit that I would argue is just as valuable: it shows your boss (or your client) that you are not a silo-marketer. You understand the whole picture. That alone tends to improve your standing inside a company, and honestly it should be reason enough to implement Blended ROAS even if you never touch a bidding target with it.
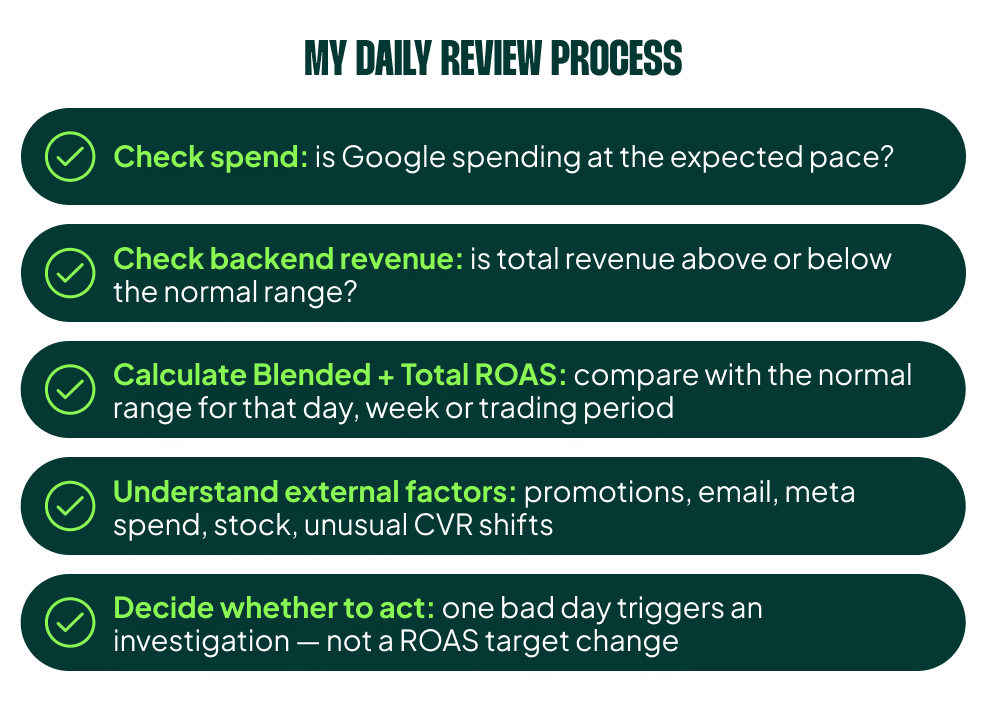
My daily review process
- Check spend. Is Google spending at the expected pace?
- Check backend revenue. Is total revenue tracking above or below the normal range?
- Calculate Blended ROAS and Total ROAS. Compare them with the normal range for that day, week or trading period.
- Understand external factors. Promotions, email campaigns, Meta spend, stock availability and unusual conversion rate changes all affect the result.
- Decide whether to act. One bad day triggers an investigation. Leave the target alone.
What I do when I find an issue
- On track: spend and backend efficiency are within the expected range. Do nothing. Resist the urge to optimise for the sake of looking busy.
- One-day deviation: investigate other business factors first. Do not touch bidding yet.
- Persistent deviation: Blended ROAS and Total ROAS stay outside the range. Now review budgets, targets and campaign performance.
- Platform and backend disagree: use the business data to set overall direction, then investigate attribution and tracking before you change bidding.
That last one is the most important rule in the list. When the platform tells you one story and the bank account tells you another, the bank account wins.
Blended ROAS Has Two Jobs
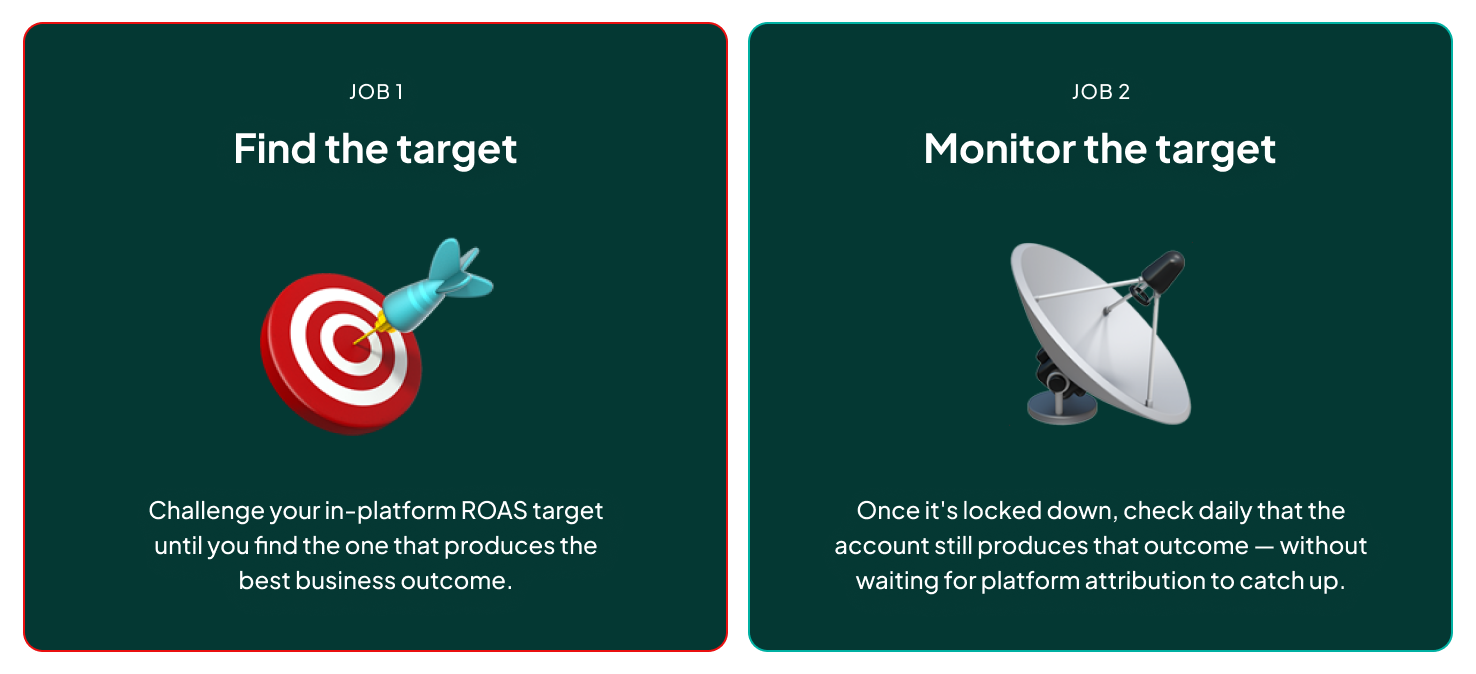
First, it helps you find the ROAS target that produces the best business outcome. Then, once that target is locked down, it helps you monitor whether the account is still producing that outcome without waiting for platform attribution to catch up.
That is the whole job. It does not do attribution, budget allocation or campaign-level diagnostics. It is a rudder.
I would like to know what your experience has been. What has worked, what gave you a false positive, and what pushback you got when you told the business that the number in the platform is no longer the number that matters.
[TL;DR]
- Platform ROAS is no longer a reliable source of truth, because tracking keeps degrading and the platforms compensate with modeled data that changes over time.
- Blended ROAS (total revenue / total ad spend) is the business-level source of truth. Google Total ROAS (total revenue / Google Ads spend) lets you evaluate Google without other channels distorting the denominator.
- Use Blended ROAS for two jobs only: finding the correct in-platform bidding target, and monitoring daily/weekly performance. It does not do attribution or budget allocation, and it is not usable at campaign level.
- To challenge a target: establish your baseline, lower the in-platform target by around 20% on enough spend to be readable in the total business, then measure over one to three months. In 8 out of 10 cases we find room to increase spend with minimal or no drop in Blended ROAS and contribution margin.
- Build a dashboard that shows ad data and business data side by side. One bad day is a cue to investigate, and nothing more.